The table structure shown in Table P6.6 contains many unsatisfactory components and characteristics. For example, there are several multivalued attributes, naming conventions are violated, and some attributes are not atomic.
Table P6.6 Sample EMPLOYEE Records
|
Attribute Name |
Sample Value |
Sample Value |
Sample Value |
Sample Value |
|
EMP_NUM |
1003 |
1018 |
1019 |
1023 |
|
EMP_LNAME |
Willaker |
Smith |
McGuire |
McGuire |
|
EMP_EDUCATION |
BBA, MBA |
BBA |
|
BS, MS, Ph.D. |
|
JOB_CLASS |
SLS |
SLS |
JNT |
DBA |
|
EMP_DEPENDENTS |
Gerald (spouse), Mary (daughter), John (son) |
|
JoAnne (spouse) |
George (spouse) Jill (daughter) |
|
DEPT_CODE |
MKTG |
MKTG |
SVC |
INFS |
|
DEPT_NAME |
Marketing |
Marketing |
General Service |
Info. Systems |
|
DEPT_MANAGER |
Jill H. Martin |
Jill H. Martin |
Hank B. Jones |
Carlos G. Ortez |
|
EMP_TITLE |
Sales Agent |
Sales Agent |
Janitor |
DB Admin |
|
EMP_DOB |
23-Dec-1968 |
28-Mar-1979 |
18-May-1982 |
20-Jul-1959 |
|
EMP_HIRE_DATE |
14-Oct-1997 |
15-Jan-2006 |
21-Apr-2003 |
15-Jul-1999 |
|
EMP_TRAINING |
L1, L2 |
|
L1 |
L1, L3, L8, L15 |
|
EMP_BASE_SALARY |
$38,255.00 |
$30,500.00 |
$19.750.00 |
$127,900.00 |
|
EMP_COMMISSION_RATE |
0.015 |
0.010 |
|
|
a. Given the structure shown in Table P6.6, write the relational schema and draw its dependency diagram. Label all transitive and/or partial dependencies.
The dependency diagram is shown in Figure P6.6a. Note that the order of the attributes has been changed to make the transitive dependencies easier to mark. (In any case, the order in which the attributes are written into a relational database table is immaterial.) The relational schema is written below Figure P6.6a.
Figure P6.6a The Dependency Diagram for Problem 6a

The relational schema is written as:
EMPLOYEE(EMP_CODE, EMP_LNAME, EMP_EDUCATION, JOB_CLASS, EMP_DEPENDENTS,DEPT_CODE, DEPT_NAME, DEPT_MANAGER, EMP_TITLE, EMP_DOB, EMP_HIRE_DATE, EMP_TRAINING, EMP_BASE_SALARY, EMP_COMMISSION_RATE)
b. Draw the dependency diagrams that are in 3NF. (Hint: You might have to create a few new attributes. Also make sure that the new dependency diagrams contain attributes that meet proper design criteria; that is, make sure there are no multivalued attributes, that the naming conventions are met, and so on.)
Dependency diagrams have no way to indicate multi-valued attributes, nor do they provide the means through which such attributes can be handled. Therefore, the solution to this problem requires a basic knowledge of modeling concepts, once again indicating that normalization and design are part of the same process. Given the sample data shown in Problem 6, EDUCATION, DEPENDENT and QUALIFICATION are multi-valued attributes whose values are stored as strings. We have created the appropriate entities to avoid the use of multi-valued attributes. (See Figure P6.6b.)
Figure P6.6b The Dependency Diagrams for Problem 6b
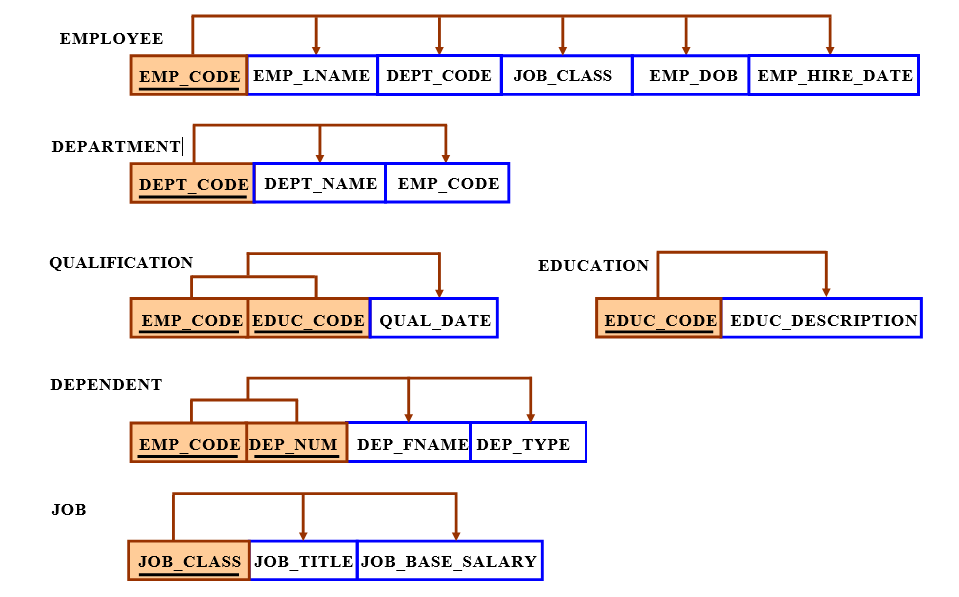
As you discuss Figure P6.6b, note that a real world design would have to include additional entities or additional attributes in the existing entities. For example, while the job description is likely to include a (job) base salary, employee experience – perhaps measured by time in the job classification and performance – is likely to add to the job’s base salary. Therefore, the EMPLOYEE table might include a salary or hourly wage adjustment attribute. Overall employment longevity is likely to be included, too … employers often find it useful to keep (expensive) job turnover rates low. And, of course, you might include year-to-date (YTD) earnings and taxes in each employee’s records, too. This problem is a great source of discussion material!
The relational schemas are written as:
EMPLOYEE(EMP_CODE, EMP_LNAME, DEPT_CODE, JOB_CLASS, EMP_DOB, EMP_HIREDATE)
DEPENDENT(EMP_CODE, DEP_NUM, DEP_FNAME, DEP_TYPE)
DEPARTMENT(DEPT_CODE, DEPT_NAME, EMP_CODE)
JOB(JOB_CLASS, JOB_TITLE, JOB_BASE_SALARY)
EDUCATION(EDUC_CODE, EDUC_DESCRIPTION)
QUALIFICATION(EMP_CODE, EDUC_CODE, QUAL_DATE_EARNED)
c. Draw the relational diagram.
The relational diagram is shown in Figure P6.6c.
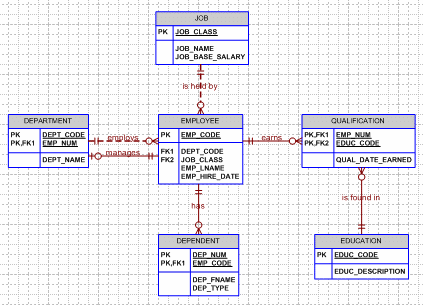
Figure P6.6c The Relational Diagram for Problem 6c

d. Draw the Crow’s Foot ERD.
The Crow’s Foot solution is shown in Figure P6.6d.
Figure P6.6d The Crow’s Foot ERD for Problem 6d